
Leadership capability maturity describes how reliably an organization develops effective leaders. Maturity models rate that reliability on a staged scale. At low levels, results depend on individual leaders and isolated programs. At higher levels, defined practices, shared ownership, and measured outcomes produce leadership consistently. HR teams and executives use the levels to diagnose their current state and decide which investment comes next.
Evidence quality varies. Most published models come from consultancies or vendors. Of the models reviewed here, only Deloitte’s has large survey data behind it, and that survey ran in 2016.
What Is Leadership Capability Maturity?
Leadership capability maturity measures how consistently an organization produces effective leaders. It rests on systems, routines, and culture rather than on any one leader. In a mature organization, leadership quality varies less between units and survives changes of leader.
The Evans Learning Labs monograph and Deloitte’s four-level model both take this organizational view.
Leadership capability in plain terms
Acorn’s guide defines leadership capability as a mix of knowledge, skills, tools, processes, and behaviors. Together, these deliver an organizational objective.
A leadership competency framework lists the behaviors an organization expects from its leaders. It is one input to capability. Capability also needs the systems that build and reward those behaviors.
Maturity describes how embedded and reliable those systems are. The models express it as levels.
One term, three meanings
This topic mix three ideas under one label. Each answers a different question.
| Meaning | Unit assessed | Question it answers | Example |
| Organizational leadership capability maturity | The organization or a business unit | How reliably do our systems produce leaders? | Deloitte’s four-level model |
| Leadership team maturity | The executive team | How well does this team decide and work together? | Stratechi’s model, which lists five competencies and no level scale |
| Individual leader maturity | One person | How have this leader’s self-awareness and judgment developed? | Veldsman’s five stages, from Confident Ability to A Higher Calling, as published in HealthManagement.org |
David Day drew a related distinction in 2000. Leader development builds an individual’s human capital: knowledge, skills, and abilities. Leadership development builds social capital: relationships, networks, and shared commitments.
Capability maturity models sit on the second side. They assess the system around people. This article uses the organizational meaning.
Where Maturity Models Come From
The logic of staged capability
The idea began in software engineering. The Software Engineering Institute (SEI) released Version 1 of its Capability Maturity Model for Software in 1991. Version 1.1 followed in 1993.
A capability maturity model is a staged roadmap for improving practices in one or more work domains.
Its core premise is sequencing. Sophisticated practices should not be attempted until the practices that support them are in place. Watts Humphrey saw why. Improved software development practices did not last unless the organization’s behavior changed to support them. Staged models build that dependency into their levels.
The software model names five levels: Initial, Repeatable, Defined, Managed, and Optimizing. CMMI renamed some of them: Initial, Managed, Defined, Quantitatively Managed, and Optimizing.
How leadership models borrowed the idea
The People Capability Maturity Model applied staging to workforce practices. SEI first released it in 1995, and the version cited here dates from July 2009. Its levels are Initial, Managed, Defined, Predictable, and Optimizing.
The Managed level begins at the unit. Managers must first accept personal responsibility for the performance and development of their unit’s workforce.
Leadership-specific models came from consultancies, vendors, researchers, and public bodies. Deloitte’s has four levels. The Evans, TeamRetro, and WCO models have five. The DJA School of Management says its model has six levels but lists seven, numbered 0 to 6.
What transfers from software and what does not
This subsection is analytical reasoning, not a published finding.
Software processes yield outputs that teams can count, such as defects per release. Leadership yields slower, noisier outputs. Promotion rates, retention, and team results arrive months or years after the practice that shaped them. Many other factors act on them too.
Leadership models therefore lean on descriptions of practice. Raters judge whether a statement fits the organization. That judgment introduces rater bias, so the rating method matters.
How the Main Leadership Maturity Models Compare
A side-by-side crosswalk
The table covers the models reviewed for this article. The final column is an analytical reading, not published research.
| Model | Unit assessed | Levels | Basis | Lowest state to highest state (analytical reading) |
| Deloitte Leadership Maturity Model | Organization | Four: Foundational, Integrated, Scalable, Systemic | Survey of 2,014 respondents, 2016 | Formal programs owned by HR to leadership embedded in culture and shared with business leaders |
| People CMM | Workforce practices | Five: Initial, Managed, Defined, Predictable, Optimizing | Process-maturity framework, first released 1995 | Inconsistent practices to continuous improvement of workforce capability |
| Evans Learning Labs | Leadership development system | Five: Reactive or Heroic, Inconsistent, Systematic, Integrated, Adaptive | Literature-based monograph | Reliance on heroic individuals to a system that updates itself from outcome evidence |
| TeamRetro | Leaders, rated by self and team | Five: Ad Hoc, Emerging, Defined, Managed, Optimized; 12 capabilities in four groups | Vendor template | Ad hoc practice to optimized practice, going by the level names |
| WCO | Customs administrations, at four intervention levels | Five per category, Initial to Optimized | Programme tool, 2023 | Individual category: unclear, irregular communication to developing future leaders as the main focus |
| Lean leadership maturity model | An organization’s lean leadership | Five cumulative levels, four dimensions, 11 sub-dimensions | Master’s thesis (Huyser, 2021); design science, expert panel validation | Not mapped; the model uses capability areas per level |
| DJA Leadership Maturity Model | Individual leader stages | States six levels, lists seven | Practitioner page | Not mapped because the level count is inconsistent |
What the models share
Reading across the models shows three recurring shifts. This is analytical synthesis, not a published finding.
- Dependence moves from individuals to systems.
- Ownership widens from HR alone, to HR with business leaders, to every leader.
- Evidence moves from activity counts to outcome data, and then to feedback loops.
Deloitte adds a distinctive point. Its top level combines four learning methods: education, experience, exposure, and environment. Lower-maturity organizations lean on education and experience. Deloitte says the most mature offer a balanced set of all four.
What Changes at Each Level
From person-dependent to defined
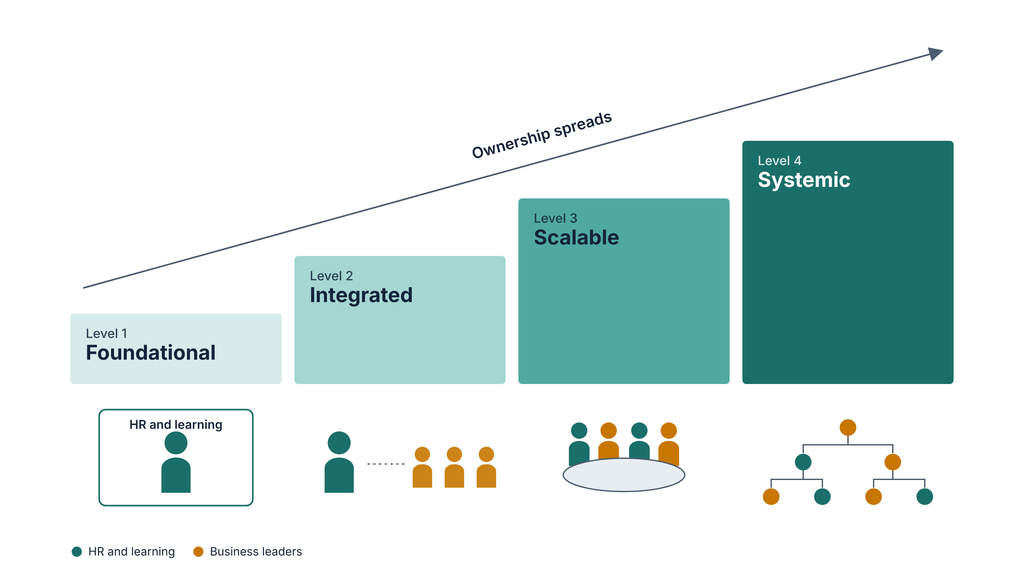
The table follows Deloitte’s published progression for selected dimensions.
| Dimension | Level 1: Foundational | Level 2: Integrated | Level 3: Scalable | Level 4: Systemic |
| Leadership model | None exists | A document held by HR, not communicated to leaders | Communicated regularly; leaders at all levels know what good leadership looks like | Aligned to strategy, built with business leaders, used for high-potential assessment |
| Main development method | Formal classes | Rotations, stretch assignments, and coaching added to classes | Networking, coaching and mentoring, and client feedback join formal and experiential methods | A wide variety, including performance dashboards and media libraries |
| Who owns development | HR and the learning function | Little collaboration between HR and business leaders | HR and business leaders collaborate | HR and business leaders collaborate regularly |
| Succession and pipeline | Executive roles only | Senior roles, applied inconsistently | Strategic, covering a wide range of critical positions | Aligned to strategy; talent moves across functions and locations |
| Risk-taking and knowledge-sharing | Risk-intolerant; no sharing | Risk-averse; little sharing | Some risk-taking; sharing grows in importance | Risk-taking encouraged; knowledge highly valued and enabled |
At level 1, programs are formal, built by organizational level, and treated as a benefit for managers. Identity is weak. Employees generally do not share values, and knowledge-sharing and risk-taking are discouraged (same page). The 2017 deck adds that this approach lacks alignment with current business needs.
Leaving level 1 is mostly a matter of definition. Leaders cannot be developed toward a standard that does not exist.
Level 2 professionalizes the function. Deloitte describes a head of leadership development and a leadership framework. Yet L&D does not work with the business, and the model stays unshared. Culture and design begin to make an impact. Employees feel part of an identity, and leaders have clear decision guidelines (same page). A model that leaders never see is unlikely to shape daily behavior.
Evans adds a warning about the middle levels. Heavy spending on coaching and training does not lift an organization above level 2 without the required infrastructure.
From defined to measured and self-improving
At level 3, business leaders and HR become co-owners. Leaders develop through networking, client feedback, and knowledge-sharing with other leaders, alongside experiential and formal training. Level 3 organizations tend to be matrixed. They begin to use business leadership itself as a development tool (same page). The 2017 deck adds coaching and mentoring to that mix.
Transparent high-potential identification appears here. Individuals know their status and receive special development opportunities. Strategic succession planning covers a wide range of critical positions (same deck). A leadership pipeline exists at most levels.
At level 4, leadership becomes part of the culture. Deloitte describes a “DNA of leadership” at this level). Leaders tell stories, coach other leaders, and answer for pipeline health at every level. The programs are embedded in organizational values and endure in good times and bad (same page).
Evans adds a measurement step above the defined level. Its fourth level tracks outcomes and quantifies the pipeline. Its fifth revises practices as the evidence demands. The author argues that acting on data takes real authority to reallocate investment.
Why the order matters
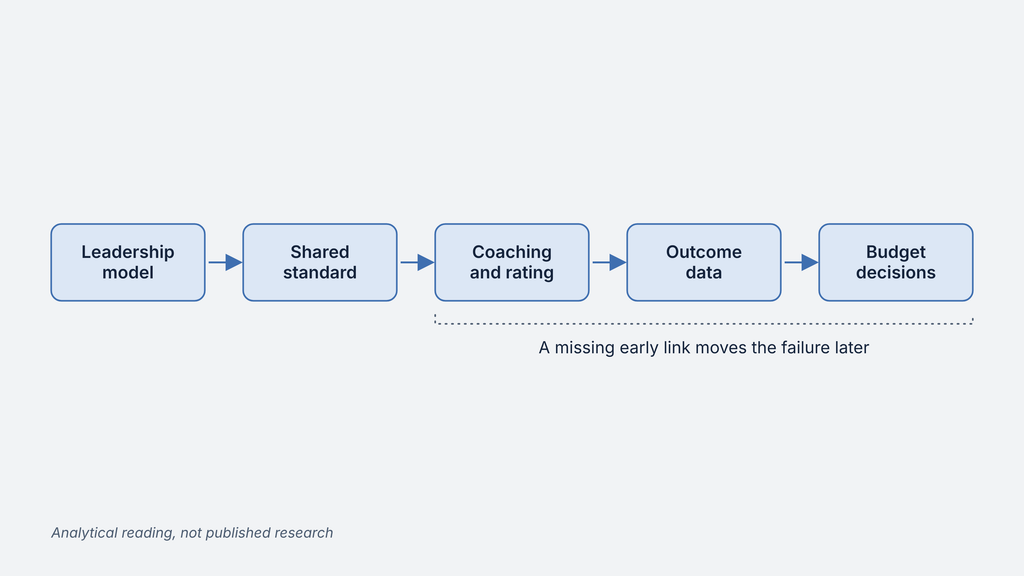
The reasoning below builds on the sources above. It is analysis, not a published finding.
Each level supplies something the next one needs. A leadership model gives leaders a shared standard. Coaches and mentors can then aim at specific behaviors, and managers can rate and sponsor leaders against the same criteria.
Outcome data matters only after that, because data needs a standard to measure against. Evidence can change practice only if someone holds the authority to move budget.
The SEI premise points the same way. Skipping a level does not remove the dependency. It moves the failure to a later stage, where diagnosis is harder.
What the Evidence Shows
The Deloitte survey
Bersin by Deloitte collected 2,014 responses from HR and business leaders in 95 countries in 2016. The survey asked about 111 organizational practices and linked them to business and leadership outcomes.
Seventeen of those practices, which the deck calls dimensions, correlated most strongly with outcomes. Deloitte grouped them into three factors: organizational culture, designed leadership, and organizational design. Five drivers ranked highest: risk-taking, knowledge-sharing, communicating the leadership model, exposure as a learning method, and HR and business collaboration.
The deck names four business outcomes. They are process efficiency, meeting or exceeding financial targets, anticipating and responding to change, and innovation.
Organizations strong in organizational culture were 4.5 times more likely to show superior performance on combined business outcomes. Designed leadership showed 3.5 times and organizational design 1.5 times.
The financial comparison splits organizations into the top and bottom halves of composite maturity scores. The top half reported revenue per employee 37 percent above the bottom half (551.65 against 402.35). Gross profit margin was 47 percent against 43 percent. Deloitte reports 95 percent confidence and controls for organization size. The slide gives no currency, unit, or data source for revenue per employee.
Computed from the two reported values, the bottom half sits about 27 percent lower. The 37 percent is the top half’s advantage. Other performance slides compare levels 1 and 2 with levels 3 and 4.
What training research adds
Maturity models describe systems. Training research tests programs. Lacerenza and colleagues pooled 335 samples in a 2017 meta-analysis of leadership training.
Effects were positive on all four criteria: reactions (δ = .63), learning (.73), transfer (.82), and results (.72). Design mattered. The abstract points to needs analysis, feedback, multiple delivery methods (especially practice), and spaced sessions.
Training can work, and its design affects how well. Deloitte reports that programs in a vacuum do not grow leadership capability. Read together, the findings suggest that a well-designed program can still underdeliver inside an immature system. That link is an interpretation.
Limits of the evidence
- The Deloitte data is a 2016 survey. This review found no update, so its current relevance is unverified.
- The findings are correlations, with no controlled test of cause.
- The deck does not say whether outcome ratings were self-reported or externally verified. It also does not explain how composite scores were calculated or mapped to levels.
- Few leadership development maturity models are documented. A workshop proposal for the ISLC 2023 conference states that very few examples exist. Another study validated one such measure in two large multinationals in southern Africa (van der Westhuizen and Hewitt).
- Staged models simplify. Units can sit at different levels, so a single blended score can mislead (Evans).
How to Assess Leadership Capability Maturity
Assess leadership capability maturity by comparing observable evidence with a level model. Combine documents, interviews, and outcome data. Rate each dimension separately, compare self ratings with team ratings, and assess each business unit on its own. Treat the result as a map of next investments, not as a grade.
A leadership capability assessment rates individual leaders. A maturity assessment looks at the capability of the business as a whole, a line Acorn also draws. Individual ratings can feed the maturity view without replacing it.
Choose the unit of assessment
Decide what you are assessing before you collect data. A whole organization, a business unit, and a leadership level can sit at different maturity levels. Evans offers an example. A corporate function can sit at level 4 while a recently acquired unit sits at level 1.
The WCO scores four levels of intervention separately: individual, management team, stakeholder, and organizational.
Collect three kinds of evidence
Evans recommends combining three sources. Document review covers program designs, succession processes, and competency frameworks. Structured interviews with managers and directors probe what leaders do in practice. Outcome data includes internal promotion rates, multisource feedback patterns over time, and retention of high potentials.
Each source checks the others. A document can describe a succession process that interviews show nobody follows. Interviews can report effort that outcome data never confirms.
Echelon Front, a consultancy, adds behavioral cues. These include ownership of problems, clear priorities, frontline decision authority, and learning after mistakes.
360-degree feedback and other multisource ratings add a further view. They show how others experience leaders, as well as what leaders report about themselves.
Score by dimension and compare raters
Rate each dimension on its own, because one total hides the pattern. Deloitte’s data shows why. At level 1, leader motivation had medium prevalence while knowledge-sharing was extremely low.
TeamRetro, a vendor, offers a routine for leader behaviors. Leaders rate themselves, their teams rate them, and the gap exposes blind spots. The vendor advises improving one or two capabilities per cycle and rerunning the check every quarter or six months.
The WCO uses statements instead of scores. An administration picks the statement that best describes its situation at each level.
Decide who rates and how often
What follows is analytical judgment.
The rater shapes the result. HR teams that rate their own programs have an incentive to rate them well. Business leaders and the people being led see the effects directly. Including both groups, plus an outside reviewer where possible, reduces that bias.
Frequency depends on the speed of change. A quarterly or six-month rerun suits a behavior check like TeamRetro’s. A whole-system assessment moves more slowly, because practices such as succession take time to change. An annual cycle plus a rerun after major restructuring is a reasonable starting point.
A hypothetical illustration
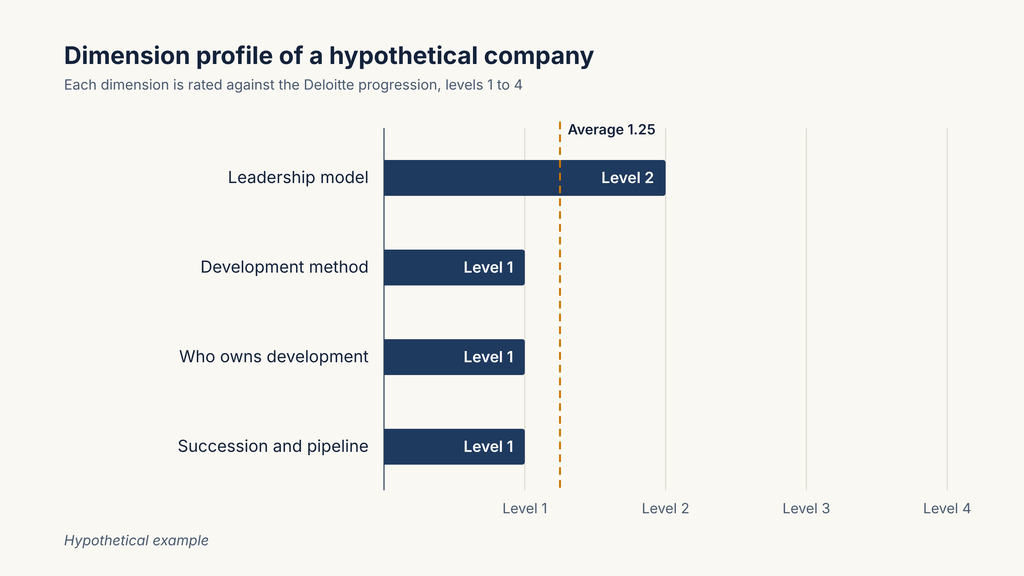
This case is hypothetical and describes no real organization. The reading applies the progression in Deloitte’s table above.
Imagine a company of 800 employees with a large training budget. HR wrote a leadership model, but only HR has seen it. Classes are the main development method. Succession planning covers executive roles only.
The dimensions land at different levels. The leadership model matches level 2. Development method, ownership, and succession match level 1. An average falls between levels 1 and 2 and hides that spread.
The pattern points to the next investment. Leaders at every level need to see the model, and business leaders need a role in development decisions. More classes would address neither gap.
Scoring errors to avoid
- Counting activity. Budget, programs, and training hours measure effort, not embedded practice.
- A documented competency framework is not proof of maturity. Evans warns that it may be adapted from a generic template. Check that it reflects your own strategy (Evans).
- Succession plans can exist on paper while the development behind them does not.
- One blended score misleads in a diverse organization.
- Self-report alone leaves blind spots.
- A score shows the current state and the next systems to build. Deloitte frames its tool that way, not as a ranking.
How to Move to the Next Level:
Typical investments by transition
Deloitte publishes suggested focus areas for each transition. The last column is an analytical reading.
| Transition | Deloitte’s suggested focus | Why it comes at this point (analytical reading) |
| Level 1 to 2 | Stronger culture, action on core values, clear identity, clear decision-making, assessing leader motivation | Gives leaders a shared standard and decision rules |
| Level 2 to 3 | More HR and business collaboration, exposure combined with experience and education, links to career development, retention of high potentials | Moves ownership beyond HR and ties development to careers |
| Level 3 to 4 | Risk-taking, knowledge-sharing, organizational support for leaders, business leader involvement, communicating the leadership model | Turns leadership into a shared cultural habit |
Evans sequences the work differently. It starts with a competency framework and consistent processes, then formalizes succession and extends development to everyone. Outcome measurement and developmental accountability follow. Improvement loops under real governance come last.
The two sequences agree that foundations come first. Dashboards come later.
Diagnostic questions can test readiness. They are analytical, not drawn from a published model.
- Level 1 to 2: Do leaders describe good leadership in the same words?
- Level 2 to 3: Do business leaders, and not only HR, teach, coach, and sponsor leaders?
- Level 3 to 4: Does outcome data show our practices change behavior?
- Level 4 to 5: Has data ever led us to stop funding a program?
Who does what at each stage
The ownership row in Deloitte’s table implies a changing role for each group. This is an analytical reading.
HR carries the whole load at level 1. Its task is to define good leadership and win executive agreement. At level 2, executives must read and use the model while HR makes it visible. By level 3, line managers coach, sponsor, and give feedback, and HR designs the system around them. At level 4, senior leaders answer for pipeline health. HR supplies the data and the standards.
The pattern is a gradual handover. HR starts as the owner and ends as the system designer.
Common mistakes
- Installing measurement before definition. Evans warns that sophisticated capability cannot be installed directly onto an immature foundation. A dashboard cannot measure a process that has not been defined.
- Deloitte argues that relying only on formal programs is one of the primary reasons for weak leadership talent.
- Skipping the manager baseline. The People CMM starts its Managed level at the unit. Organization-wide programs often fail when thrust on unprepared managers.
- Assuming leaders want to grow here. Almost all respondents in Deloitte’s survey want to grow as leaders. Not all want to do so at their current company.
How to Choose a Model
Match the model to the question you need answered.
| Your situation | Better fit | Reason |
| Diagnose the whole leadership development system and set investment order | Deloitte’s four-level model or an Evans-style five-level model | Both assess the organization. Deloitte has survey data behind its dimensions |
| Run a recurring check of leader behaviors with team input | A TeamRetro-style capability rating | Self and team ratings expose blind spots. It is a vendor template, and its page shows no outcome evidence |
| Assess a public-sector leadership programme | A WCO-style statement assessment | Built for Customs administrations; the administration picks a statement at each level |
| Improve workforce practices beyond leadership | The People CMM | Wider workforce scope |
| Assess lean leadership | The lean leadership maturity model | Built for lean leadership, with capability areas on five cumulative levels |
Four criteria help narrow the choice. Check what unit the model assesses and what evidence supports it. Then check whether its level descriptions are public and whether it names next steps.
When a staged model fits poorly
The limits below come from analysis, not published evidence.
A very small organization may have only a handful of leaders. Formal pipeline governance may cost more than it returns there. A direct conversation about leadership expectations may do more than a five-level assessment.
Fast-changing organizations face another problem. Acquisitions, reorganizations, and new business lines reset parts of the system. Last year’s score may describe a structure that no longer exists. Rerun the assessment after major structural change, not only on a calendar.
A higher level is also not always the goal. Level 5 practices need data, authority, and governance, and each has a running cost. Weigh that cost against the scale and stakes of the leadership system.
Conclusion
Leadership capability maturity describes the system that produces leaders, and the main models agree on its direction. Dependence moves from individuals to defined practice, then to measured and self-correcting systems. The models differ in labels, evidence, and scope.
The strongest evidence is correlational. Deloitte’s 2016 survey links maturity to outcomes without showing cause, and training research tests programs rather than systems. A score works best as a sequencing tool. Define good leadership first, share ownership with business leaders next, then measure outcomes and adjust practice. Assess units separately, and repeat the assessment after structural change.
Over the long run, the useful habit is to keep testing whether the leadership system still fits the strategy.
An assessment shows where the leadership system is weakest. The next question is what to build first. Early-level organizations need a shared standard, and higher-level ones need outcome feedback loops. A leadership development strategy turns that diagnosis into a sequenced plan for programs, experiences, and governance.